Der Debugmodus von Limesurvey ist ein praktischer Helfer bei der Fehlersuche. Er lässt sich ganz…
Limesurvey: Create a login-free live Report for Survey-Participation
It was scouring the limesurvey forum for some useful limesurvey add ons and tools and found this gem that I need to share with you. Major part of the code is taken from the limesurvey forum, but I adapted it to fit my needs.

Creaqte a file named survey_stat.php inside your limesurvey installation root and put in the following content:
<?php
//https://www.limesurvey.org/community/forums/future-features/94882-survey-statistic-without-an-useraccount
//Connect to the database you use for limesurvey

//call it like this:
/*

OLD USE THIS!!
http://yourdomain/survey_stat.php?survey=181952&title=Client%20Name

NEW
http://yourdomain/survey_stat.php?sid=1010101,2020202,3030303&title=Client%20Name
http://yourdomain/survey_stat.php?sid=181952&title=Client%20Name

*/

/*
try {
    $db = new PDO('mysql:host=yourhost.com;dbname=lime_db', 'user', 'pass');
}*/

$config_folder = dirname(__FILE__) . '/application/config/';
$config_file = $config_folder . 'config.php';
define('BASEPATH', dirname(__FILE__) . '/..'); // maybe wrong but doesn't matter - constant needs to be set.
$config = require($config_file);
$db = $config["components"]["db"];

//  DB credentials
define('DB_SERVER', "localhost");
define('DB_USER', $db["username"]);
define('DB_PASSWORD', $db["password"]);
//

try {
  $db = new PDO($db["connectionString"] . "charset=utf8", DB_USER, DB_PASSWORD);
} catch (PDOException $e) {
    print "Error!: " . $e->getMessage() . "<br/>";
    die();
}

function participants_pd($sid, $db) {
	//get the number of participants for each day of the survey
	$facts = array();
	$x = 0;
	if(!is_numeric($sid)) {
		echo "Survery ID must be a valid number";
		exit();
	}
	else {
		$survey_tbl = "lime_survey_".$sid;
		$query = "select date(`submitdate`) AS date, count(`id`) AS number from `$survey_tbl` where `submitdate` != 'NULL' group by date(`submitdate`)";
		$stmt = $db->query($query);
		while($r = $stmt->fetch(PDO::FETCH_OBJ)) {
				$facts['date'][$x] = $r->date;
				$facts['count'][$x] = $r->number;
				$x++;
		}
		$db = null;
		return $facts;
	}
}

function participants_sum($sid, $db) {
	//get number of participants of the survey
	if(!is_numeric($sid)) {
		echo "Survery ID must be a valid number";
		exit();
	}
	else {
	$survey_tbl = "lime_survey_".$sid;
	$sum = "";
	$survey_tbl = "lime_survey_".$sid;
	$query = "select count(`id`) AS sum from `$survey_tbl` where `submitdate` != 'NULL'";
	$stmt = $db->query($query);
	$r = $stmt->fetch(PDO::FETCH_OBJ);
	$sum = $r->sum;
	return $sum;
	}
}

function titles($sid, $db) {
	//get the titles
	$title = "";
	$query_t = "select `surveyls_title` from `lime_surveys_languagesettings` where `surveyls_survey_id` = :sid";
	$stmt_t = $db->prepare($query_t);
	$stmt_t->bindParam(':sid', $sid);
	$stmt_t->execute();
	$r = $stmt_t->fetch(PDO::FETCH_OBJ);
	$title = $r->surveyls_title;
	return $title;
}

//Getting the ID's of the surveys
if(isset($_GET['survey'])) {
	$titles = array();
	$participants = array();
	$surveys = array();
	//check if there are more then one surveys-ids
	if(preg_match("/,/", $_GET['survey'])) {
		//there are more then one survey
		$surveys = explode(",", $_GET['survey']);
	}
	else {
		$surveys[] = $_GET['survey'];
	}
	foreach ($surveys as $key => $value) {
		//Get the number of participants for each day of the survey of each survey
		$arrayname = "survey".$value;
		${$arrayname} = participants_pd($value,$db);

		//Get number of participants for the whole periode
		$participants[] = participants_sum($value,$db);

		//Get the titles of the surveys
		$titles[] = titles($value,$db);
	}
}

/**
* generating the data string for the google chart
* Will look something like that:
* ['Day','Title S1','Title S2','Title S3'],
* ['2013-10-08',35,462,101],
* ['2013-10-09',15,101,33],
* ['2013-10-10',7,37,10],
* ['2013-10-11',5,14,1],
* ['2013-10-13',2,10,1]]);
*/

//First the column names of the chart (in our case Day and the titles )
$data = "['Day'";
foreach ($titles as $key => $value) {
	$data = $data.",'".$value."'";
}
$data = $data."]";

//Check which survey the most days
//The x-axis of the chart will filled with the dates of this survey
$max = 0;
$max_sid = "";
foreach ($surveys as $key => $value) {
	$arrayname = "survey".$value;
	if($max < count(${$arrayname}['date'])){
		$max = count(${$arrayname}['date']);
		$max_sid = $key;
	}
}

//fill in the numbers of participants
$x = 0;
while ($x < $max) {
	$data = $data.",['".${"survey".$surveys[$max_sid]}['date'][$x]."'";
	foreach ($surveys as $key => $value) {
		$arrayname = "survey".$value;
		if(!empty(${$arrayname}['count'][$x])) {
		$data = $data.",".${$arrayname}['count'][$x];
		}
		else {
			$data = $data.",0";
		}
	}
	$data = $data."]";
	$x++;
}
//$data contains now a string with the JS Data Array
//<?=$data has to be placed in the JS containing the google chart function


//Setting the title of the site (can be the name of the project or of the costumer)
$title = "Development of the numbers of participants ";
if(isset($_GET['title'])) {
	trim($_GET['title']);
	htmlentities($_GET['title']);
	$title = $title.$_GET['title'];
}
?>
<!DOCTYPE html>
<html>
<head>
<meta charset="UTF-8">

	<title><?=$title?></title>

	<style type="text/css">
	body,html {
		font-family: Droid Sans;
		font-size: 13px;
		margin:0px;
		width: 100%;
		height: 100%;
		background-color: grey;

	}
	h1 {
		font-size: 18px;
		background-color: white;
		margin-left: 0px;
		width: 50%;
		padding: 5px;
	}
	h2 {
		font-size: 15px;

	}
	.stat {
		width: 50%;
		background-color: white;
		padding: 5px;
	}
	.stat_li {
		width: 25%;
		float: left;
		text-align: right;
	}
	.stat_re {
		width: 45%;
		float: left;
		margin-left: 5%;
		font-weight: bold;
	}
	</style>

  <script type="text/javascript" src="https://www.google.com/jsapi"></script>
    <script type="text/javascript">

      //set up the chart
      //check out https://developers.google.com/chart/ for more options
      google.load("visualization", "1", {packages:["corechart"]});
      google.setOnLoadCallback(drawChart);
      <?php
      if(isset($_GET['survey'])) {
      ?>
      function drawChart() {

        var data = google.visualization.arrayToDataTable([
          <?=$data?>
        ]);

        var options = {

        };

        var chart = new google.visualization.LineChart(document.getElementById('chart_div'));
        chart.draw(data, options);
      }
      <?php
  		}
      ?>
    </script>

</head>

<body>
<h1><?=$title?></h1>
<h2>Overall participants</h2>
<div class="stat">
<?php
if(isset($_GET['survey'])) {
	$x = 0;
	foreach ($participants as $key => $value) {
		echo "<div class='stat_li'>".$titles[$x].":</div><div class='stat_re'>".$value." Participants</div><div style='clear:both;'></div>";
		$x++;
	}
}
?>
</div>
<h2>Development of the participation</h2>
<div id="chart_div" style="width: 51%; height: 50%;"></div>
</body>
</html>
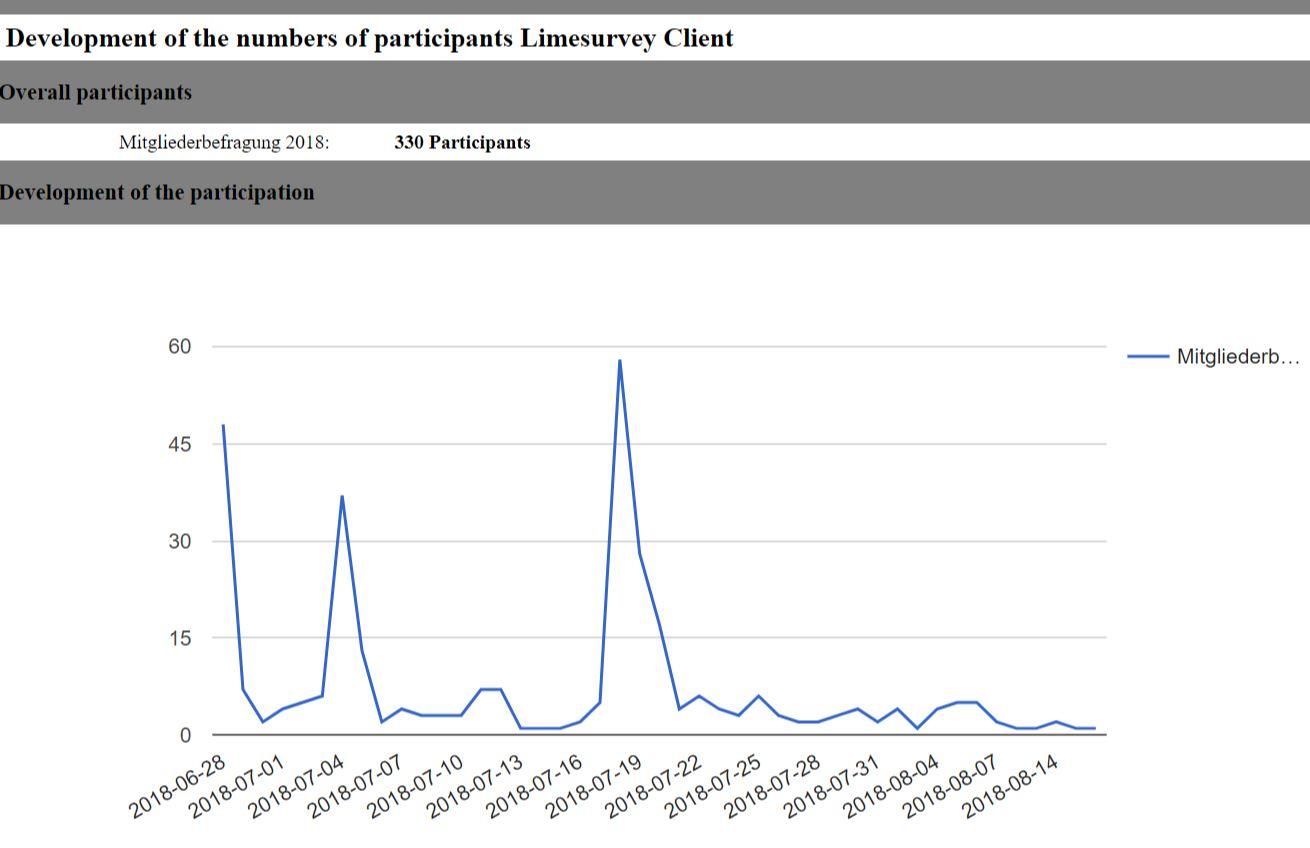
Depending on the limesurvey version you are using use one of the following link-syntaxes to create the participation-report on the fly. You just need to change the domain, define I proper report title (use %20 fpr spaces) and enter the corrent Survey-IDs (seperated by comma if you want to show more than one):
- http://yourdomain/survey_stat.php?survey=1010101,2020202,3030303&title=Client%20Name
- http://yourdomain/survey_stat.php?sid=1010101,2020202,3030303&title=Client%20Name
The resulting report should look like this and might be a very usful thing for your clients so that they can monitor overall participation:
Please also follow the according discussion here:
- https://www.limesurvey.org/community/forums/future-features/94882-survey-statistic-without-an-useraccount
Other useful ressources:
- Module that creates an option to have a report sent to the participant at the end of the survey:
https://framagit.org/SondagePro-LimeSurvey-plugin/sendPdfReport - https://www.limesurvey.org/forum/german-forum/113800-probleme-mit-arithmetisches-mittel-standardabweichung
Frühere Beiträge